Select Infographics
from the Obama White House
Ashleigh Axios worked in the Obama White House from 2012 to 2016. During that time she had the opportunity to work with a number of agencies, offices, and colleagues on infographics that broke down complex issues and proposals for easier and more enjoyable public consumption online.
This page contains a selection of White House infographics.
“An infographic, even a long one, beats a 300-plus-page report any day.”
Budget-Related Infographics

President Obama’s
2014 Budget Proposal
The 2014 Budget presented President Obama's plan to address these important questions: How do we attract more jobs to our shores? How do we equip our people with the skills needed to do those jobs? And how do we make sure that hard work leads to a decent living? This infographic was a core part of the Office of Digital Strategy’s plan for addressing these questions.
Direction: Colleen Curtis
Copy: Megan Slack
Design: Ashleigh Axios
The Infographic Reads
2014 United States Budget
Top 10 Things You Need to Know About President Obama’s Budget
The 2014 Budget presented by President Obama:
Makes America a magnet for jobs by ending tax breaks for companies who ship jobs overseas and rewards businesses that hire here at home.
Creates jobs and builds the communications and transportation network our businesses need to succeed…
Gives small businesses a 10 percent tax credit to hire new workers and increase wages.
Builds on the progress in our housing market to cut red tape and help responsible homeowners save $3,000 a year…
Equips Americans with the real world skills they need to find a good job or prepare for college…
Provides high-quality preschool for every child so they’re prepared for school at an early age and have the opportunity for a good job later in life…
Ensures hard work leads to a decent living by raising the minimum wage to $9 an hour…
Makes tough choices and meets Republicans more than halfway to finish the job of more than $4 trillion in balanced deficit reduction…
Includes 215 cuts, consolidations, and savings proposals which are projected to save more than $25 billion in 2014…
Ensures millionaires pay at least the same tax rates as middle class families by establishing the Buffett Rule.
Launched: April 10, 2013
A Balanced Plan to Avert the Sequester and Reduce the Deficit
President Obama put forward a plan to avoid sequestration's harmful budget cuts and reduce the deficit in a balanced way — by cutting spending, finding savings in entitlement programs and closing tax loopholes.
Direction: Jennifer Palmieri & Macon Phillips
Design: Kodiak Starr
Design: Ashleigh Axios
The Infographic Reads
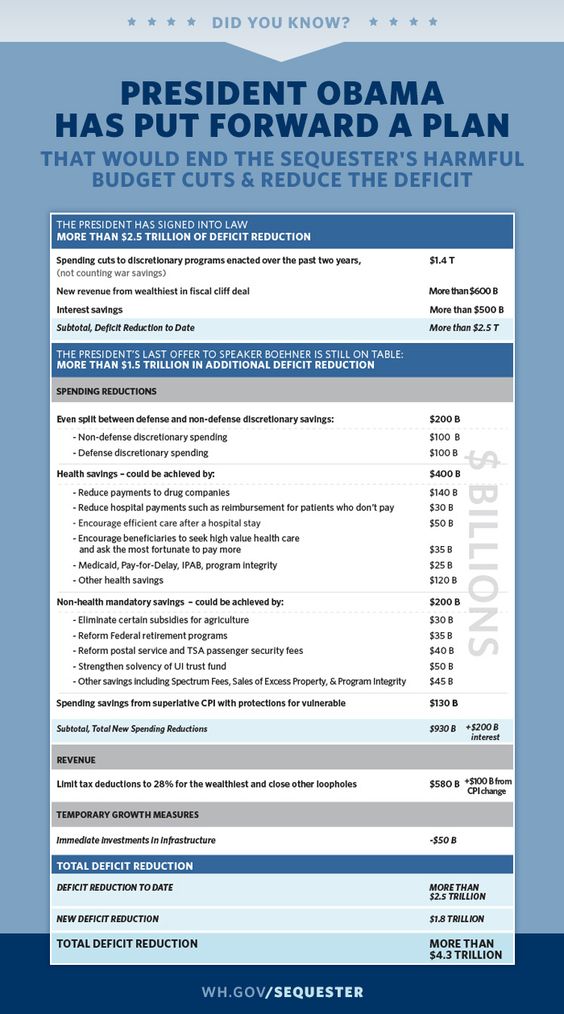
President Obama has put forward a plan that would end the sequester’s harmful budget cuts and reduce the deficit.
The President has signed into law more than $2.5 trillion of deficit reduction…
The President’s last offer to Speaker Boehner is still on the table: more than $1.5 trillion in additional deficit reduction…
Total deficit reduction:
Deficit reduction to date: more than $2.5 trillion
New deficit reduction: $1.8 trillion
Total deficit reduction: more than $4.3 trillion
Launched: February 2013
Health Care Infographics
President Obama promised that he would make quality, affordable health care not a privilege, but a right. After nearly 100 years of talk, and decades of trying by presidents of both parties, that's exactly what he did. The following infographics support these changes as these efforts were under attack during President Obama’s second term in office.
Benefits of ACA
In 2014, millions of people had peace of mind about their health care that they lacked before the Affordable Care Act was passed, including better protections and access to health care, and new options for finding affordable coverage. This infographic helped highlight the change over time.
Design: Ashleigh Axios
The Infographic Reads
5 reasons we’re better off because of The Affordable Care Act.
Before Obamacare, 62% of adults found it difficult or impossible to find affordable coverage when they tried to buy coverage on the individual market.
After Obamacare, nearly 6 out of 10 uninsured Americans can get coverage for $100 a month or less in 2014.
Before Obamacare, 47% were denied coverage or charged more because of pre-existing conditions when trying to purchase coverage on the individual market.
After Obamacare, insurance companies must cover essential benefits and annual or lifetime limits on insurance coverage are outlawed.
Before Obamacare, 15% annual premium increase for people who stayed in their individual market plans for more than a year.
After Obamacare, insurance companies must now publicly justify rate increases of 10% or more before raising any premium.
Before Obamacare, 6.9% average annual growth in U.S. health care spending.
After Obamacare, health care costs are growing at their slowest rate on record thanks in part to Obamacare.
(The graphic continues…)
Launched: January 22, 2014
How Health Reform Benefits Americans
Design: Ashleigh Axios
The Infographic Reads
Learn how health reform benefits Americans
Free preventive care
Check-ups, vaccines and screenings like mammograms and colonoscopies are covered by insurance at no cost.A new way to get insurance, by state
Compare options based on price and benefits, enroll in a plan through the Health Insurance Marketplace, opening October 1.Coverage for young adults under 26
6.6 million young adults can stay on their parent's’ plan until turning age 26.Coverage for pre-existing conditions
Starting in 2014, insurance companies can’t charge you more or deny insurance because you’ve been sick, or charge women more.No cancellations of lifetime limits on care
Insurance companies can’t cancel coverage or limit what they’ll spend when you get sick.Rebates from insurance companies
If your insurer spends too much on overhead and not enough on your health care, you get a rebate.Lower cost coverage
Through the Marketplace, you may qualify for lower monthly premiums depending on your income and family size.Prescription drug savings for seniors
Nearly 3.5 million people with Medicare saved an average of more than $706 each on their prescriptions in 2012.
(The graphic continues…)
Launched: January 22, 2014
Call for State Medicaid Expansion
Design: David Hudson
Design: Ashleigh Axios
The Infographic Reads
States refusing to expand medicaid will leave 4.3 million Americans uninsured.
4.2 million residents in states expanding Medicaid coverage will gain access to affordable health insurance.
(The graphic continues…)
Launched: June 4, 2015
How ACA Supports Medicare
Design: Ashleigh Axios
The Infographic Reads
The Affordable Care Act Strengthening Medicare
Nearly 50 million older Americans and Americans with disabilities rely on Medicare each year. The Affordable Care Act makes Medicare stronger by adding new benefits, fighting fraud, cutting costs, and improving care for patients:
The amount the average person with Medicare will save by 2021 because of the new law: nearly $4,200
Number of traditional Medicare enrollees provided with at least one new free preventive service in 2013 due to the Affordable Care Act: 25.4 million
Seniors and people with disabilities on Medicare saved over $8.9 billion so far on prescription drugs because of the new health care law
By 2020, the Medicare prescription drug coverage gap will be closed:
Seniors who have prescription drug costs that hit the “donut hole” will save as much as $15,700 by 2021.
The average savings Medicare beneficiaries who hit the donut hole received on prescription drugs so far.
The Affordable Care Act increases federal sentencing guidelines for health care fraud offenses by 20-50 percent for major fraud crimes…
(The graphic continues…)
Launched: February, 2014
We the People: Petition Infographics
The United States constitution guarantees each citizen the right to petition the government. Built and launched in 2011, We the People offered a powerfully simple way to petition the Obama Administration to take action on a range of issues. If a petition crossed the threshold of signatures, policy officials reviewed it and published an official response.
The following sample of infographics were updates from the White House to the public on the performance of the We the People petitions platform over time. This was done to promote transparency, increase public use of the tool, and to promote accountability in the White House’s role in assessing and responding to the petitions.
Data pulls: Pete Welsch
Copy: Ezra Mechaber
Design: Ashleigh Axios
We the People Numbers After One Year
The infographic reads
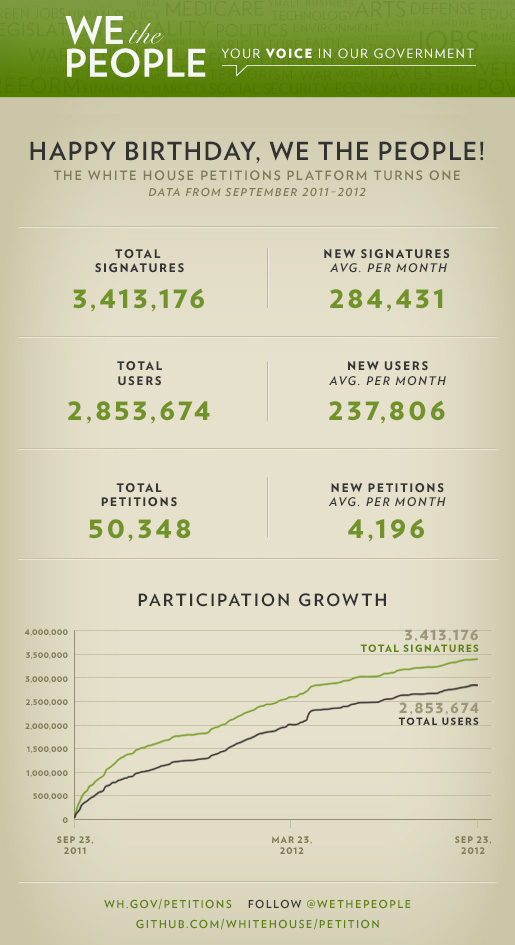
Happy birthday, We the People! The White House petitions platform turns one.
Total signatures: 3,413,176
New signatures (avg per month): 284,431
Total users: 2,853,674
New users (avg per month): 237,806
Total petitions: 50,348
New petitions (avg per month): 4,196
Data from: 2011–2012
Launched: September 2012
Petition Growth Over Time
The infographic reads
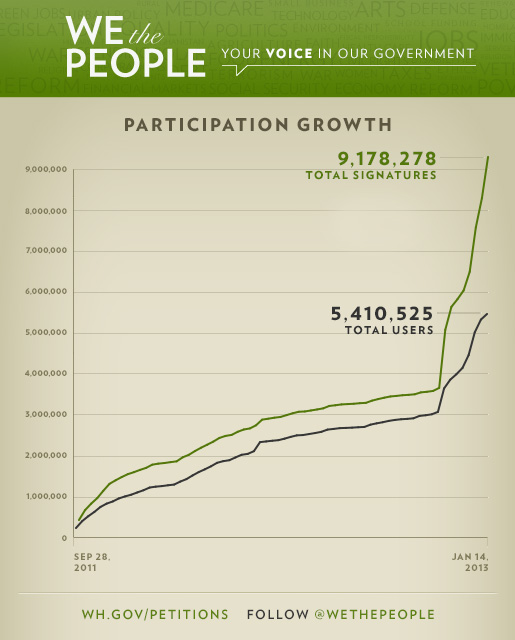
Petition Growth:
Total signatures: 9,178,278
Total users: 5,410,525
Data from: 2011–2013
Launched: January 2013

We the People Update
The infographic reads
Total users: 2,756,057
Total petitions: 45,901
Total signatures: 3,320,520
Top 5 petition categories
Human rights
Civil rights
Economy
Government reform
Family
Signatures
Most signatures on a petition: 150,945
Average signatures per hour: 406
Percent that have signed more than 1 petition: 15.2%
Responses
Petitions have crossed the threshold for a response: 112
Agencies & departments that have responded: 20
Have received a response: 11 million
Surveyed signers who received a response say
Would create or sign another petition: 89%
The response was helpful: 78%
Learned something new: 50%
Data from: 2011–2012
Launched: July 2012
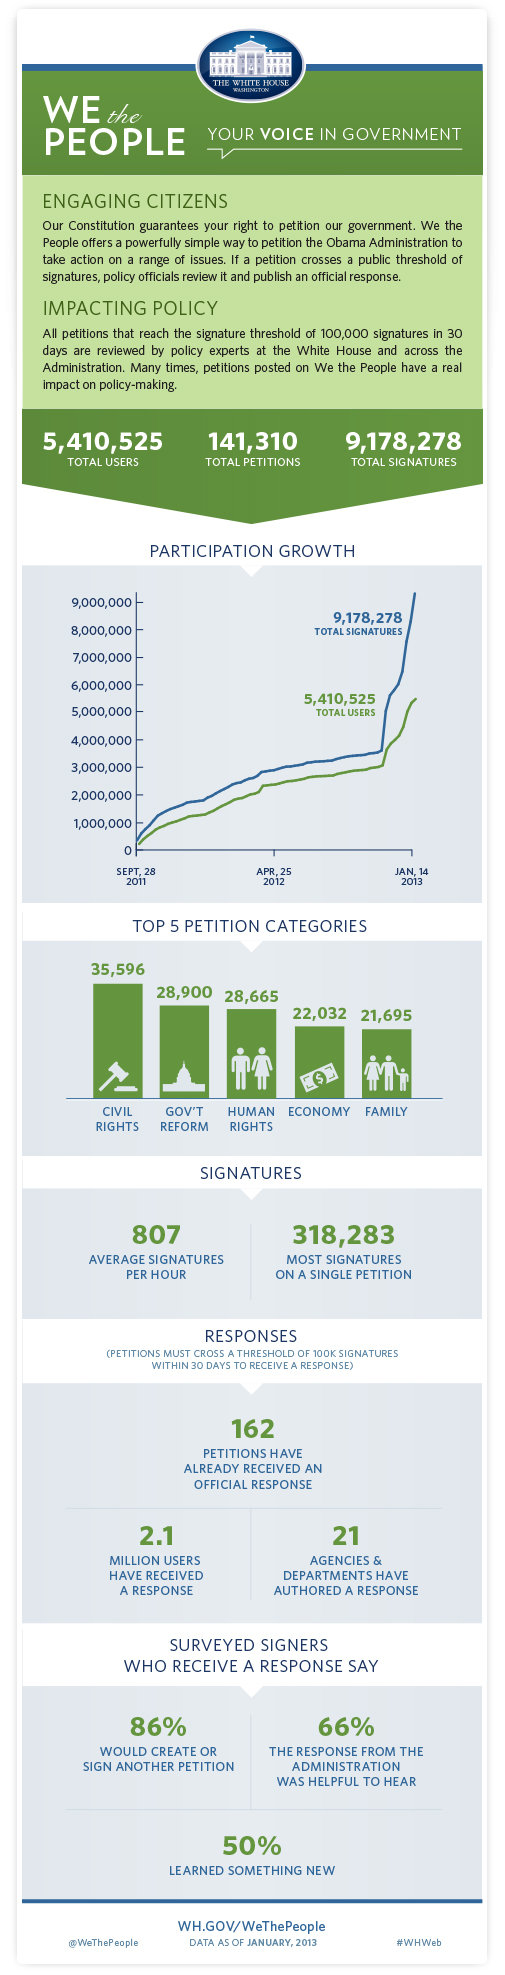
We the People Update
The infographic reads
Total users: 5,410,525
Total petitions: 141,310
Total signatures: 9,178,278
Top 5 petition categories
Civil rights
Government reform
Human rights
Economy
Family
Signatures
Average signatures per hour: 807
Most signatures on a single petition: 318,283
Responses
Petitions that have received an official response: 162
Users who have received a response: 2.1 million
Agencies and departments who have authored a response: 21
Surveyed signers who received a response say:
Would create of sign another petition: 86%
The response was helpful: 66%
Learned something new: 50%
Data from: 2011–2013
Launched: January 2013
Background Checks
Details
Copy: Megan Slack
Design: Ashleigh Axios
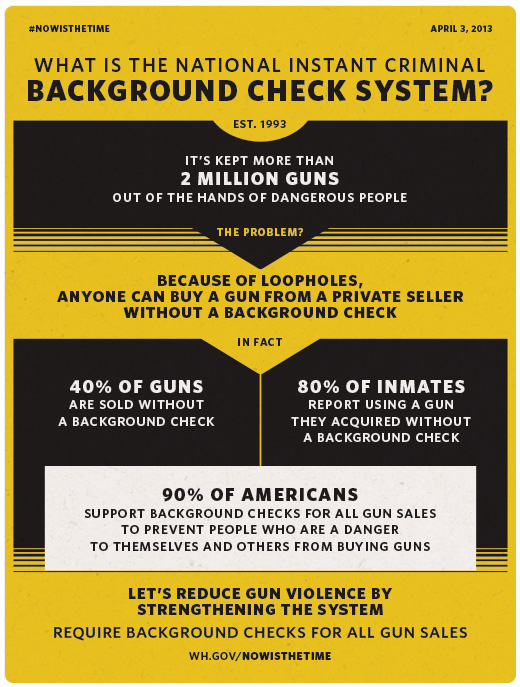
The infographic reads
What is the national instant criminal background check system?
Established in 1993, it’s kept more than 2 million guns out of the hands of dangerous people.
The problem?
Because of loopholes, anyone can buy a gun from a private seller without a background check. In fact:
40% of guns are sold without a background check
80% of inmates report using a gun they acquired without a background check
90% of Americans support background checks for all gun sales to prevent people who are a danger to themselves and others from buying guns. Let’s reduce gun violence by strengthening the system. Require background checks for all gun sales.
Created March 2013
Launched April 2013
Equal Pay
This series of infographics was made to launch with the Equal Pay policy section of Obama’s WhiteHouse.gov. It breaks down some of the core issues with equal pay in the United States as understood in 2012.
Details
Direction: Colleen Curtis
Copy: Megan Slack
Design: Ashleigh Axios
Created in 2012
Launched June 2012
Updated in June 2013
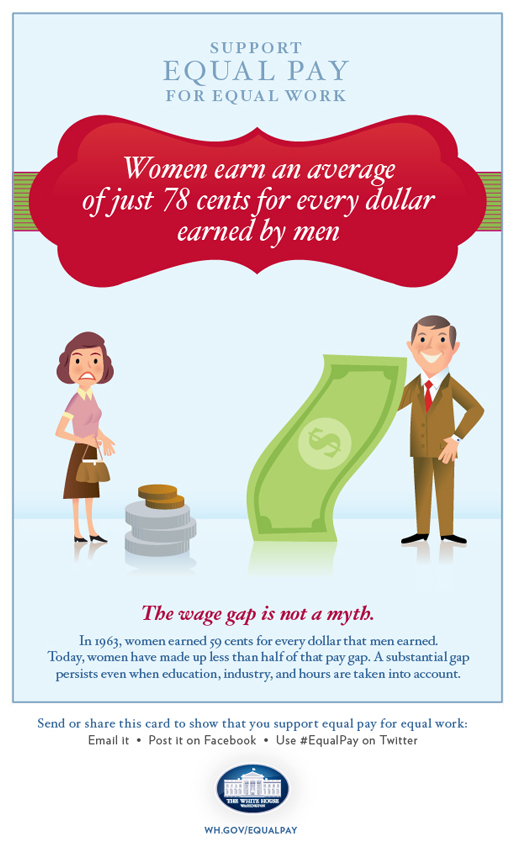
The Pay Gap is Not a Myth
The infographic reads:
Support Equal Pay for Equal Work
Women earn an average of 78 cents for every dollar earned by men.
The wage gap is not a myth. In 1963, women earned 59 cents for every dollar that men earned. Today, women have made up less than half of that pay gap. A substantial gap persists even when education, industry, and hours are taken into account.
Equal Pay Supports Families
The infographic reads:
Support Equal Pay for Equal Work
In more than 50% of American households, women are breadwinners.
It’s true, in more than 50% of American households, women’s salaries help pay the bills, buy groceries, and provide for their families. When women earn less than their fair share, that loss harms women and weakens their families, communities, and our entire economy.


Equal Pay Closes
the Wage Gap
The infographic reads:
Support Equal Pay for Equal Work
The gender wage gap puts women at a career-long disadvantage.
In 2011, a typical 25-year-old woman working full time all year earned $5,000 less than a typical 25-year-old man. In just ten years, her cumulative lost wages will reach $34,000. According to U.S. Census data, by age 65, the average woman will have lost $431,000 over her working lifetime as a restult of the earnings gap.
Equal Pay Supports Families
The infographic reads:
Support Equal Pay for Equal Work
49,000,000 children depend on women’s salaries.
Today, more than 50 percent of households have women breadwinners. When women earn less than their fair share, that loss harms women and weakens their families, communities, and our entire economy.

Middle Class Tax Cuts
DetaiLS
Creative Direction
& Design: Kodiak Starr
Copy: Megan Slack
Design & Illustration:
Ashleigh Axios
Created & Launched August 2012
Infographic reads
Extending Middle-Class Tax Cuts
its’ the right thing to do
Continuing tax cuts for 98 percent of American families. President Obama’s plan will make sure the 98 percent of American families with income of less than $250,000 continue to fully benefit from the income tax cuts that are set to expire at the end of 2012.
Lower tax rates on the first $250,000 of income, affecting 114 million middle-class families
Marriage: Couples will not be penalized with higher taxes because they file jointly, affecting 38 million couples
American opportunity tax credit: Families will continue getting help to pay for college, affecting 11 million families
Doubled child tax credit: Families will continue receiving a Child Tax Credit worth $1,000 per child, affecting 35 million families with children
Continuing tax cuts for the 97 percent of small businesses. President Obama’s plan would continue tax benefits that benefit 97 percent of small business owners. He’s also proposed two new tax credits to help businesses hire and grow.
Everyone, including those with incomes over $250,000, will also benefit from:
Lower tax rates on the first $250,000 of income
Marriage penalty relief
Tax deductions for up to $250,000 of new investment
Immediate write-offs for new investment: Let’s firms continue to claim immediate tax write-offs for new investment through 2012, putting an additional $50 billion in the hands of businesses in 2012 and 2013.
A 10 percent income tax credit for firms that hire more workers or increase wages: The credit is capped, which helps target its benefits to smaller businesses.
(The graphic continues…)
Education Technology
Creative Direction, Design, Illustration, Copy: Ashleigh Axios
Partner: Knatokie Ford, PCAST Fellow
Created & Launched December 2013
Infographic Reads
President’s Council of Advisors on Science and Technology
Education Technology
Realizing the full potential of innovative technologies in higher education
A letter report from the President’s Council of Advisors on Science and Technology (PCAST) identifies opportunities to help put an affordable and effective college education within reach for more students in the United States.
The Challenge:
The cost of education in the U.S. is rising.
Over the past three decades:
The average tuition at a public four year college has increased by more than 250%
While the average incomes for American families only grew by 16%
There’s a persistent enrollment gap. College enrollment rates consistently vary according to family income level — with the lowest enrollment rates observed in lower-income families.
Of high school graduates in 2011:
52% of those who have from low-income families immediately enrolled in college.
66% of those who came from middle-income families immediately enrolled in college.
82% of those who came from high-income families immediately enrolled in college.
The 30% gap above hasn’t improved in any measurable way in nearly four decades.
Many students do not complete their degree within six years
…
The opportunity: Many emerging technologies have the potential to improve access to higher education. Some have been combined and packaged as massive open online courses of “MOOCs.”
MOOCs enable fundamental innovations in teaching and learning:
Real time feedback and assessment of student performance
Scalability of classes to reach broader audiences
Continuous improvement of course content
Increased connectivity amongst students
…
More students are utilizing online education: The number of college students taking at least one online course reached an all-time high in 2011.
In 2002, 1.6 million students were enrolled in at least one online course
In 2011, 6.7 million students were enrolled in at least one online course
(The graphic continues…)

Climate Change Infographic
Creative Direction, Design, Illustration: Ashleigh Axios
Created & Launched June 2013
Infographic Reads
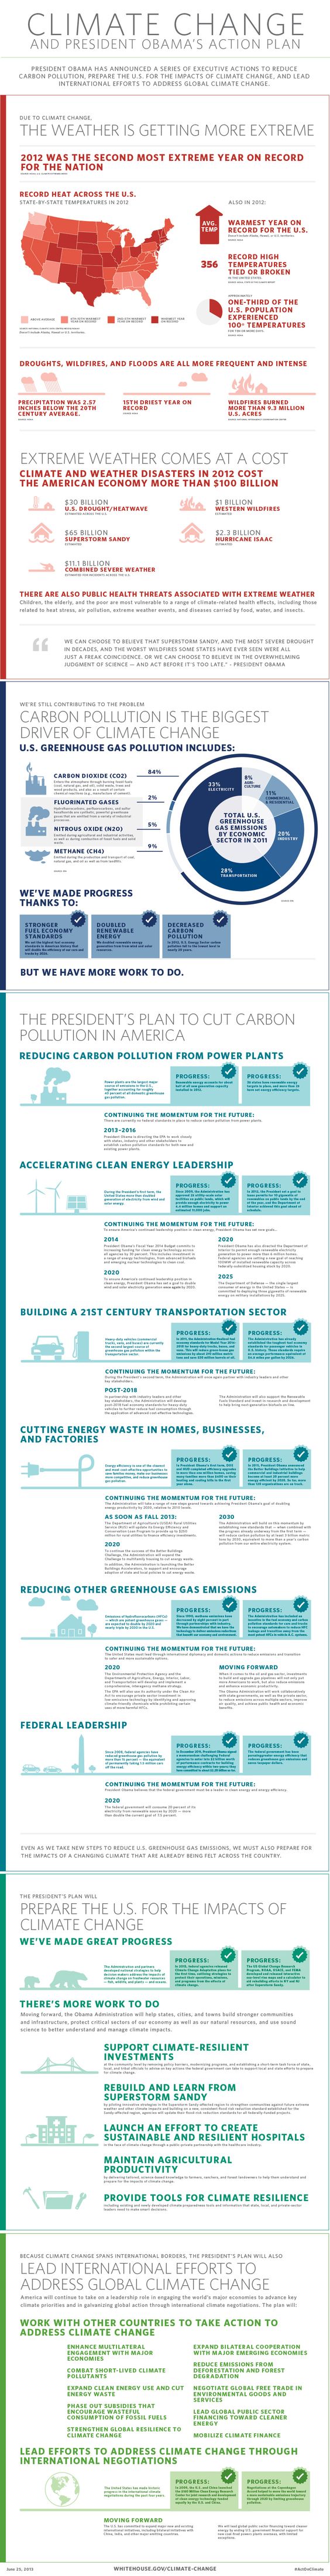
Climate Change and President Obama’s Action Plan
President Obama has announced a series of Executive Actions to reduce carbon pollution, prepare the U.S. for the impacts of climate change, and lead international efforts to address global climate change.
Due to climate change, the weather is getting more extreme
2012 was the second most extreme year on record for the nation
Record heat across the U.S. (state-by-state temperatures in 2012)
Warmest year on record for the U.S.
Record high temperatures tied or broken
Approximately one-third of the U.S. population experienced 100 degree temperatures
Droughts wildfires and floods are all more frequent and intense.
Participation was 2.57 inches below the 20th Century average.
15th driest year on record
Wildfires burned more than 9.3 million U.S. acres
Extreme weather comes at a cost. Climate and weather disasters in 2012 cost the American economy more than $100 billion.
$30 billion estimated across the U.S. for drought and heatwaves
$65 billion estimated towards superstorm sandy
$11.1 billion estimated for incidentals of combined severe weather across the U.S.
$1 billion estimated toward western wildfires
$2.3 billion estimated toward hurricane Isaac
There are also public health threats associated with extreme weather. Children, the elderly, and the poor are most vulnerable to a range of climate-related health effects, including those related to heat stress, air pollution, extreme weather events, and diseases carried by food, flood water, and insects.
(The graphic continues…)